
Page 690 - Best Practice Oral Presentation SP Sharing2025
P. 690
P22
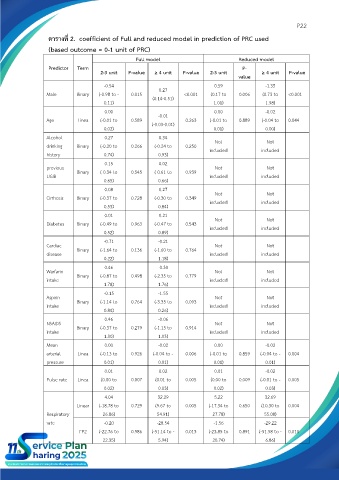
ตารางที่ 2. coefficient of Full and reduced model in prediction of PRC used
(based outcome = 0-1 unit of PRC)
Full model Reduced model
Predictor Term P-
2-3 unit P-value ≥ 4 unit P-value 2-3 unit ≥ 4 unit P-value
value
-0.54 0.59 -1.35
Male Binary (-0.98 to - 0.015 0.27 <0.001 (0.17 to 0.006 (0.73 to <0.001
0.11) (0.14-0.51) 1.01) 1.98)
0.00 -0.01 0.00 -0.02
Age Linea (-0.01 to 0.589 (-0.03-0.01) 0.263 (-0.01 to 0.889 (-0.04 to 0.044
0.02) 0.01) 0.00)
Alcohol 0.27 0.34
drinking Binary (-0.20 to 0.266 (-0.24 to 0.250 Not Not
history 0.74) 0.93) included included
0.15 0.02
previous Not Not
UGIB Binary (-0.34 to 0.545 (-0.61 to 0.939 included included
0.65) 0.66)
0.08 0.27
Cirrhosis Binary (-0.37 to 0.728 (-0.30 to 0.349 Not Not
0.53) 0.84) included included
0.01 0.21 Not Not
Diabetes Binary (-0.49 to 0.963 (-0.47 to 0.543 included included
0.52) 0.89)
-0.71 -0.21
Cardiac Binary (-1.64 to 0.136 (-1.60 to 0.764 Not Not
disease included included
0.22) 1.18)
0.46 -0.30
Warfarin Not Not
intake Binary (-0.87 to 0.498 (-2.35 to 0.779 included included
1.78) 1.76)
-0.15 -1.55
Aspirin Binary (-1.14 to 0.764 (-3.35 to 0.093 Not Not
intake included included
0.84) 0.26)
0.46 -0.06
NSAIDS Not Not
intake Binary (-0.37 to 0.279 (-1.15 to 0.914 included included
1.30) 1.03)
Mean 0.00 -0.02 0.00 -0.02
arterial Linea (-0.13 to 0.926 (-0.04 to - 0.006 (-0.01 to 0.859 (-0.04 to - 0.004
pressure 0.01) 0.01) 0.01) 0.01)
0.01 0.02 0.01 -0.02
Pulse rate Linea (0.00 to 0.007 (0.01 to 0.005 (0.00 to 0.009 (-0.01 to - 0.005
0.02) 0.03) 0.02) 0.03)
4.04 32.29 5.22 32.69
Linear (-18.78 to 0.729 (9.67 to 0.005 (-17.34 to 0.650 (10.30 to 0.004
Respiratory 26.86) 54.91) 27.78) 55.08)
rate -0.20 -28.54 -1.56 -29.22
FP2 (-22.76 to 0.986 (-51.14 to - 0.013 (-23.85 to 0.891 (-51.58 to - 0.010
22.35) 5.94) 20.74) 6.86)